Streamline Service Level Indicator (SLI) Management Using SLI Deployer
Ashish Sharma
December 5, 2024
4 minutes read
Share
In today’s fast-paced tech environment, monitoring the performance of numerous services efficiently is crucial. Service Level Indicator (SLI) Deployer automates the creation and deployment of SLI/SLO dashboards, saving time and reducing errors. In this guide, we’ll explore how to install, configure, and use SLI Deployer to streamline your monitoring processes.
Overview of Service Level Indicator (SLI) Deployer
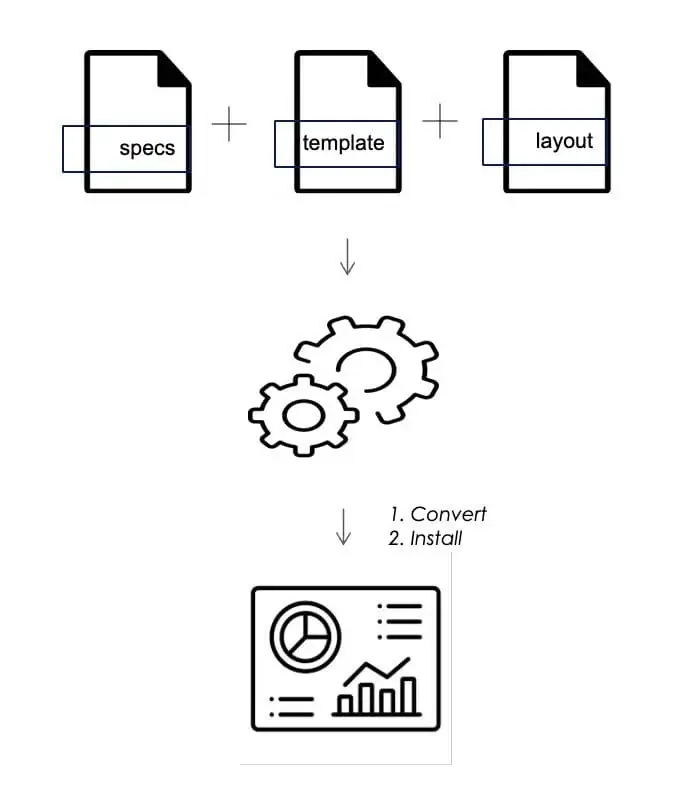
Service Level Indicator (SLI) Deployer is an innovative “Dashboard as Code” solution designed to automate the creation of SLI/SLO dashboards. This open-source tool, implemented as a Maven plugin, leverages the Apache Velocity engine to generate dashboard templates. Utilizing OpenSLO-based configurations ensures that SLI specifications are compliant with Kubernetes YAML format. These templates and specifications are then used to produce a dashboard file, which can be seamlessly integrated into Grafana to create a complete dashboard.
Aligned with SRE best practices that advocate for task automation to enhance efficiency, SLI Deployer is a significant step in that direction. It offers the flexibility to be extended to various data sources such as Prometheus, Datadog, AppDynamics, New Relic, and more.
Architecture
Key Features
Automation of Deployment: Save time by deploying changes across all dashboards with a few commands. Centralized Configuration: Manage all important configurations in .yml files. Flexibility: Extendable to various data sources like Prometheus, Datadog, and more.
What is SLI, SLO and SLA?
SLI (Service Level Indicator): This is the actual measurement of a service’s performance metric, such as uptime, which might have a value like 99.9%. The Service Level Indicator value should be higher than the SLO value to avoid penalties. SLO (Service Level Objective): This represents the target value for a performance metric agreed upon between the client and the company to ensure the SLA is met. For example, if the SLA requires 99% uptime, the SLO might be set at 99.5%. SLA (Service Level Agreement): This is a formal agreement between a service provider and the client, specifying the performance standards, such as 99% uptime, that the provider commits to meeting.
What is Apache Velocity
Velocity is an open-source template engine that can be used to generate various types of content such as JSON, XML, HTML, or other code. It enables users to incorporate references that retrieve values from Context objects within Java code. By using control structures like for-loops, if-else statements, and variables, you can embed business logic directly within your templates to produce the desired output files, such as JSON or XML.
Problem Statement
When your application attracts hundreds of thousands of users daily and your company provides numerous services, monitoring each service on the server becomes essential. This is where observability platforms like Grafana come into play. However, with many services running on the server, you end up needing a Grafana dashboard for each one, which can become quite like each other.
If any changes are required, such as adjusting the color of an availability panel to red at a different threshold, you will likely need to apply this change to all dashboards. Modifying each Grafana dashboard individually is time-consuming and inefficient.
Additionally, with numerous dashboards, viewing their queries or other configurations necessitates opening each panel one by one. This calls for a centralized place where all dashboard configurations can be viewed and managed efficiently.
Furthermore, if a client wants to change or add something to an SLI/SLO dashboard, they must request the company to make these changes, even for minor adjustments. There is no user interface that allows clients to easily modify the dashboards themselves.
How SLI Deployer can be utilized
SLI Deployer offers significant time savings by automating the deployment process for Grafana dashboards. With Service Level Indicator (SLI) Deployer, you can make necessary changes in a few configuration or template files, and then deploy these changes across all Grafana dashboards with just a few clicks and commands.
This tool enhances the readability of Grafana dashboards by consolidating all crucial panel configurations into .yml files. These files include details such as queries, panel types, names, positions on the dashboard, and more. Additionally, SLI Deployer allows for version-controlled management of SLIs, ensuring that all changes are tracked and easily reversible if needed. In summary, SLI Deployer streamlines the process of updating and managing multiple Grafana dashboards, making it an invaluable tool for maintaining consistency and efficiency.
SLI Deployer enables users to create SLIs (Service Level Indicators) and update Grafana dashboards by calling the APIs of SLI Deployer and aims to provide:
Auto-validation for SLI/SLO Specification
Integration with various data sources like AppDynamics, New Relic, Prometheus, etc.
Canvas for creating application flows and highlighting service issues
Alert Manager integration for customizable alerts
Real World Use Cases
Scenario 1: Service Monitoring: Automatically generate dashboards for new services. Scenario 2: Threshold Updates: Quickly update threshold settings across multiple dashboards. Scenario 3: SLI/SLO Management: Do faster install/upgrade SLI/SLO Specifications with better readability/review. Scenario 4: Error Budget Alerting: With SLI/SLO being managed as a code, it is easy to implement Error Budget as Alerting.
How to install SLI Deployer
Prerequisites: Ensure Maven and Git are installed. Clone the Repository: git clone Build the Project: mvn clean install -DskipTests Verify Installation: Check the generated files and logs for errors. Setup Configurations: Edit .yml and .vm files as needed. Deploy Changes: mvn sli-repository:install -DtemplatePath=/path/to/templates -DdashboardConfigDir=/path/to/config-dir -DapiKey=GrafanaApiKey -Durl=/url/for/Grafana/Import-Json
Conclusion
SLI Deployer is an extremely useful tool for companies operating at a large scale and using Grafana for server monitoring. It saves time by automating the deployment process of Grafana dashboards and enhances the readability and manageability of dashboard configurations. Additionally, the Service Level Indicator (SLI) Deployer Web UI will provide even more ease and flexibility in creating and managing SLIs and SLOs.
Altimetrik is committed to protecting your personal information. To apply for a position, you will need to provide your email address and create a login. Your information will be used in accordance with applicable data privacy laws, our Privacy Policy, and our Privacy Notice.